Conway's Game of Life: Developing a Cellular Automaton
Conway’s Game of Life, designed by John Horton Conway in 1970, is a captivating cellular automaton. What makes it truly intriguing is that it’s a game of zero players, meaning its evolution is solely determined by the initial state, without requiring any input once the game starts.
The Rules
The game board is a flat grid that wraps around like a doughnut. It’s composed of squares, which represent cells. Each cell has eight neighbors, including those in diagonal directions. Cells can be in one of two states: “live” or “dead” (on or off). The state of all cells evolves in discrete time units or turns. All cells update simultaneously on each turn, following these simple yet fascinating rules:
- A dead cell with exactly three living neighbors will come to life.
- A living cell with two or three living neighbors will continue to thrive; otherwise, it will perish.
These rules govern the entire game and lead to complex and mesmerizing patterns. To learn more, you can visit the Wikipedia page.
User-Friendly GUI
The control window provides an intuitive interface to run the game. It also displays population statistics for each state and generation. You can start, pause, and reset the game at any time. Additionally, you can customize the colors as shown below.
 Control window
Saving and Loading Patterns
A noteworthy feature of this implementation is the ability to save and load patterns. To save a pattern, simply draw it on the grid and click the save button. You can also specify a name for the pattern.
 Dialog for saving patterns
Once patterns are saved, you can effortlessly load them. This operation cleans the grid and loads the selected pattern.
 Dialog for loading patterns
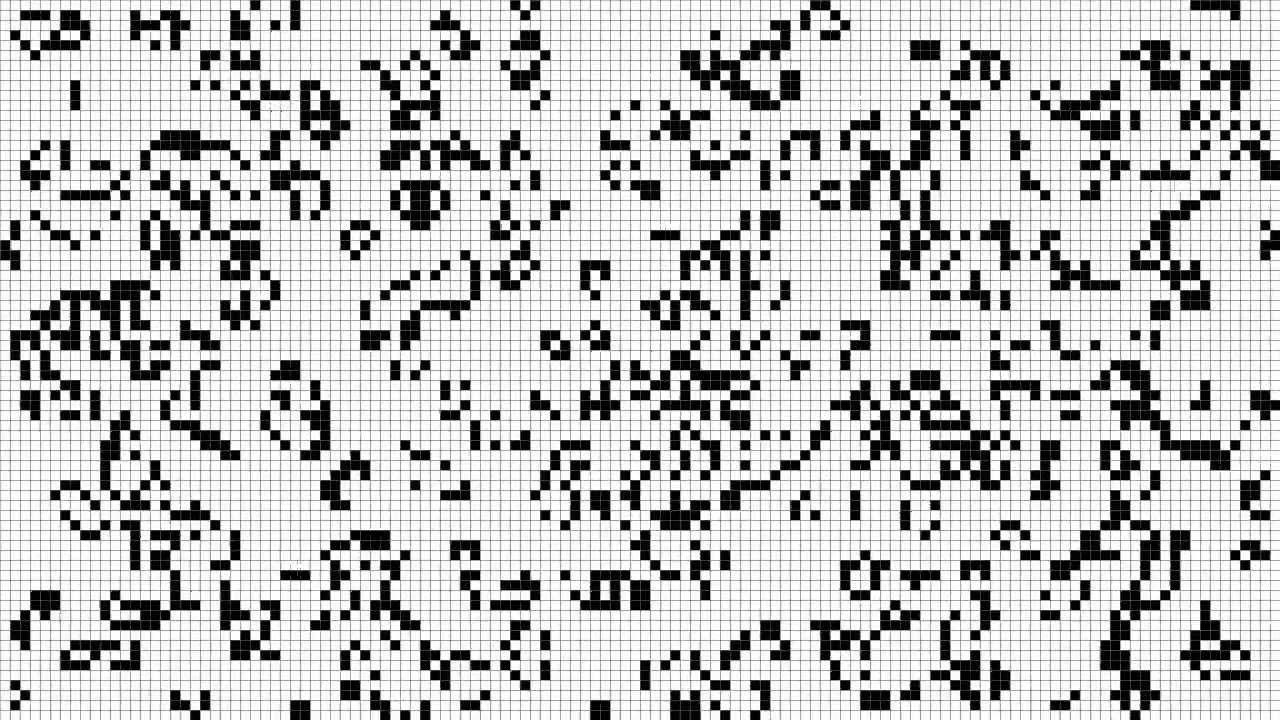
Grid Visualization
The grid provides a visual representation of state changes. Since the board wraps around like a doughnut there are limited edges. This implementation uses a toroidal grid, which is a two-dimensional grid with periodic boundary conditions. This means that the top and bottom edges are connected, as well as the left and right edges.
 Grid visualization
Animations and GIF Files
For those who appreciate visualizing patterns over time, this implementation offers the ability to generate animations. You can specify a folder path for saving generated images, customize colors, and even use a file to generate random patterns based on its content.
When you generate an animation, you’ll obtain a GIF file, similar to the one shown bellow. You can even create infinite loops for continuous fascination.
 Infinite loop
Explore Examples
Want to dive right in? You can download various patterns and examples from here. Feel free to download and explore this project. Your comments and feedback are greatly appreciated!